
| Articles | Documents | Equipment | Events | Links | Membership | Miscellaneous | Scrapbook | Targets | What's New |
| How Do You Find Your Best Load? | August 1997 |
| Dan Martinez
| |
|
Mike Kelley likes to write about various techniques
to optimize your accuracy, ranging from how you assemble your ammo to barrel quality. I’m
going to talk about accuracy in this story from a different point of view. I’m going to
try to give you a technique which will help you answer the question, "Accuracy: How do I
know when I’ve got it?"
On the face of it, it seems obvious. You try various techniques such as load development, barrel bedding, trigger lightening and crisping, even tuning your BOSS. You shoot some groups, compare it to how you’ve shot in the past, and decide whether that last fix helped you or not. Right? So what if you shoot, say five groups, and they range from very nice to pretty mediocre. Well, you could chalk up that mediocre group to shooter error, throw it out and average the rest. That’s one way, it’s a good method, and it’s on the road to where I’m taking you. Obviously, there’s more to my method, or I could stop right here. Let me back up a bit, and give you some background on how I found myself using this method. Last year about this time, I was doing some experimentation with my Browning BOSS A-Bolt in .30-06, trying to find the "sweet spot" for 165 grain bullets. I tried 17 different settings over the range of adjustment, shooting five 5-shot groups at each setting. Then for each 5 group set, I calculated an average, counting each and every shot and each and every group. As an afterthought, I also calculated standard deviation for each 5-group set. I recognized that standard deviation was "interesting" in helping me interpret the results, but I wasn’t quite sure why. This year, I started looking forward to Bob Stoltz’s Varmint Shoot several months in advance. The closest thing I have to a varmint rig, is my Savage model 24F combination gun in .223 over 12 gauge. I’ve also written previously about this favorite gun of mine. It was my turkey gun. I say "was", because Game and Fish changed the rules on me this year and outlawed rifles for spring turkey. It had a long-eye-relief fixed 4x shotgun scope mounted on high see-thru rings. I decided that if it couldn’t be a turkey gun anymore, I was gonna make it into my varmint rifle. Is that really a very good idea? Combination guns are not known for stellar accuracy, especially firing long strings out of one barrel. Gerhard wrote about how his Blaser Bockbüchsflinte strings vertically as the rifle barrel warms, but the shotgun barrel remains cool. On the latest Savage combo gun, the F model, the barrels are attached solidly together only at the breech end. At the muzzles, a slip fit barrel band arrangement allows the barrels to expand independently. Though I had never done any real accuracy work with the Savage, I never noticed a tendency toward stringing, so I decided to give it a go. The first thing to go was the scope arrangement. In its place, I mounted a Simmons 4-12 x 40 AO scope from the Prohunter series (not very expensive at around $110) on low-as-I-could-go Millett rings. Next, I revisited the trigger for further lightening and crisping. It still trips on the heavy side at around 4˝ - 5 lbs, but that’s much better than the factory 11. Good enough for now. But that’s all as far as the gun is concerned. Viola! It’s now my varmint rifle. I didn’t want to go higher power with the variable scope, as the bottom end power would have gone higher than 4x. I wanted to retain some semblance of usefulness for fall turkey hunting, where rifles are still allowed (for now). Next was the ammo. Since starting to reload a year and a half ago, I had not yet reloaded for the .223, and I was looking for a reason to start. I had so much fun the year before chasing accuracy in the .30-06 with my own reloads, I was looking forward to doing similar work with the .223. So I attacked the task with a similar methodology. Load 25 rounds of each particular load to test. Fire five 5-shot groups, measure and analyze. The key to my method is in a refinement to the analysis I performed for my BOSS testing.
Here we go again with the number crunching. Mike Kelley took a poke at me last time about my love of number crunching. Well, I don’t wear a pocket protector, but I can usually be found near a calculator, or more often, a computer. Sorry, it’s an occupational affliction. Now for a 5-minute lesson in statistics. As for most real-world phenomena, the science of statistics (or sadistics, as an instructor used to purposely mis-pronounce it) can be a very useful tool in modeling the behavior of shooting iron. When we shoot 5 groups and take an average, we are assuming that the 5 groups we shoot are representative of all groups that we could shoot with that particular combination of gun and ammunition components assembled in the same manner, given infinite time and resources to shoot an infinite number of groups. But we don’t have infinite time, so we take a sample and make inferences based on that limited data. But averages are not the end of the story. Suppose we could shoot a whole lot more than just 5 groups, say 500 groups. And we arranged the data in a vertical bar chart with groups approaching zero on the left, and the max group size achieved (let’s say 3 inches) on the right. Let’s make a bar for every 1/8" from 0 to 3 inches. Each bar’s height represents the number of groups that lie ±1/16" from the bar’s nominal group size (for example, the 1" bar represents the number of groups that are between .938" and 1.063"). What you will end up with is a histogram with the approximate shape of a normal distribution, or a bell curve.
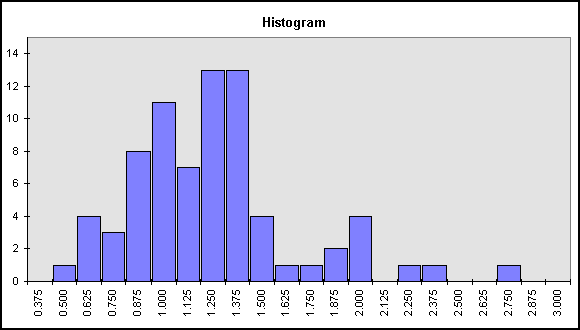
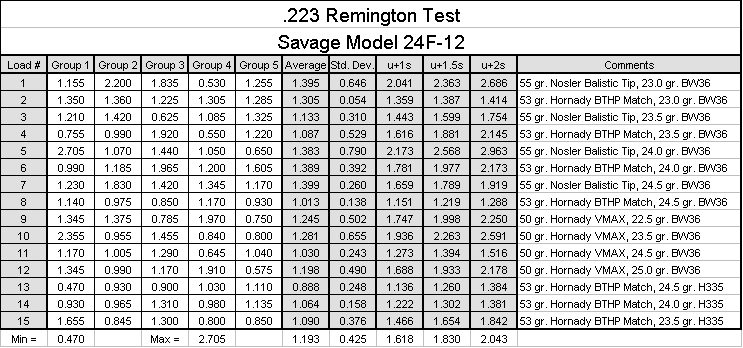
But the real world is never that nice, so you probably won’t get a perfectly shaped bell curve. Take a look at the histogram for my data. Of course it represents much fewer than 500 samples. The more data you have the better the results will be. Not all normal distributions are created equal, of course. Their shape is determined by two main factors: the sample average (symbolically denoted by the Greek symbol µ) and the sample standard deviation (denoted by the symbol s). So, even with only 5 groups, we can calculate an average, and a standard deviation, and using Excel, we can synthesize a bell curve which represents all the possible groups which would be fired with a particular load, based on the info provided by just the 5 groups we did fire. Let me pick on one of my loads at random, say load 10. The average for that load was 1.281" with a standard deviation of .655". An interesting tidbit of info that statistics provides us is the prediction that 97.7% of all possible values will be less than the average plus 2 times the standard deviation (µ+2s). For load 10, this number would be 2.591" Now load 10 is nothing to crow about, so let’s take a look at one of the best loads. Statistics will guarantee that 97.7% of the groups I will fire with load #8 will be less than 1.288". Guarantee is a strong word of course. I could flinch badly a couple of times and ruin the guarantee. Plus, there are some fine points in statistics that require more like 30 groups of each load for this guarantee to really hold, but the basic analysis technique is nevertheless sound. Number crunching is all fine and dandy, but man is a visually-oriented creature. Additional insights can be gained by looking at the synthesized bell curves of your best loads. These bell curves can be generated using Excel’s NORMDIST function, with average group size and standard deviation as inputs:
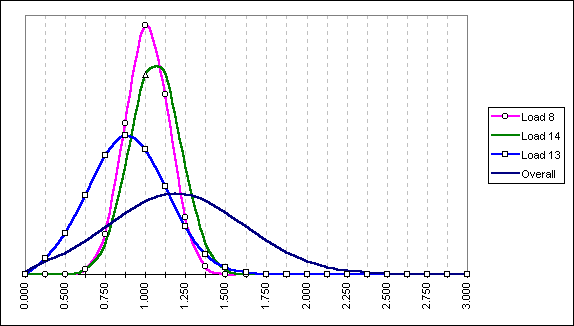
First, it’s important to understand that these bell curves each have the same amount of area underneath them. The bell curves for loads 8 and 14 are taller because they are squeezed tighter together. They are squeezed tighter together because they have smaller standard deviations. Looking at the curve for load 8, not only can we say that 97.7% of the groups will be less than 1.288", but we can also say that 95% of the groups will be between .737" and 1.288" (the average plus or minus two standard deviations). This is important, because it also tells us how small we can expect the groups to get on our best day with this load. On the other hand, look at load 13. It is noticeably broader than load 8, but it also has a noticeably lower average, .888" to be exact. If we look strictly at our µ+2s number of 1.384", it loses out to both loads 8 and 14. But graphical examination of the data reveals that a big chunk of the area under the curve lies lower than the smallest groups we can expect out of loads 8 and 14. That chunk of bell represents a substantial probability of shooting groups less then ľ" with this load. What’s that you say? Even without all this fancy bell curve stuff, you would have picked load 13 as the winner anyway, based solely on it’s lower average? Yeah, I must admit that that would probably have worked out just fine in this case. But when wouldn’t it have worked? Well what if I had another load that averaged .888 or thereabouts, but it had a standard deviation that made its bell curve look as squatty as the one in the picture for the overall? If you weren’t paying attention to standard deviation, you’d have a 50/50 chance of making the right choice. The notes in the spreadsheet give the high points of the loads I was shooting. In general, I found that my most accurate bullet of the three I tested was the 53 grain Hornady HP Match bullet. BW36 is a cheap short grain extruded powder imported from China by B-West Imports. Dick Plowden offered me a good deal on a couple of pounds. It’s an ideal powder for .223, seeming to have similar charge weights and velocities to H335 in the .223, though it looks nothing like H335, physically. Noted in the notes, is that I did switch to real H335 in loads 13, 14, and 15, but not noted, is that I also switched from Federal standard small rifle primers, to Federal match small rifle primers. I don’t know whether it was the powder or the primers, but whether you decide the best load by looking at the best average, best µ+1s, or best µ+2s, two of my best four loads were fired with H335 and the match primers. As I try new combinations, it is a simple matter to add the data to the spreadsheet. I have the spreadsheet arranged so that whatever column I sort on, average, µ+1s, or µ+2s, the three loads that land at the top will automatically get graphed into the bell curves for visual analysis. By the way, I had only tested loads up through number 12 before Stoltz’s Varmint Shoot, so my pick for the competition was load 8. How’d I do? Well, I came in third behind a Sako in 6mm PPC, and a "real" varmint rifle (another Savage .223, but a fluted heavy-barrel bolt action) wielded by Chuck Cullumber. Not too shabby for a shotgun! If anyone is interested in understanding more about this analysis process, and you know your way around an Excel spreadsheet, download a copy of the spreadsheet from the link below:

Savage223.xls © Honeywell Sportsman Club. All rights reserved. | |
| If you enjoyed this story, or found it useful, please consider clicking here to join the NRA at a discount of $15 off the normal membership cost. You will be supporting both this website and adding your voice in support of the Second Amendment. Thank you very much. |

|
|
|